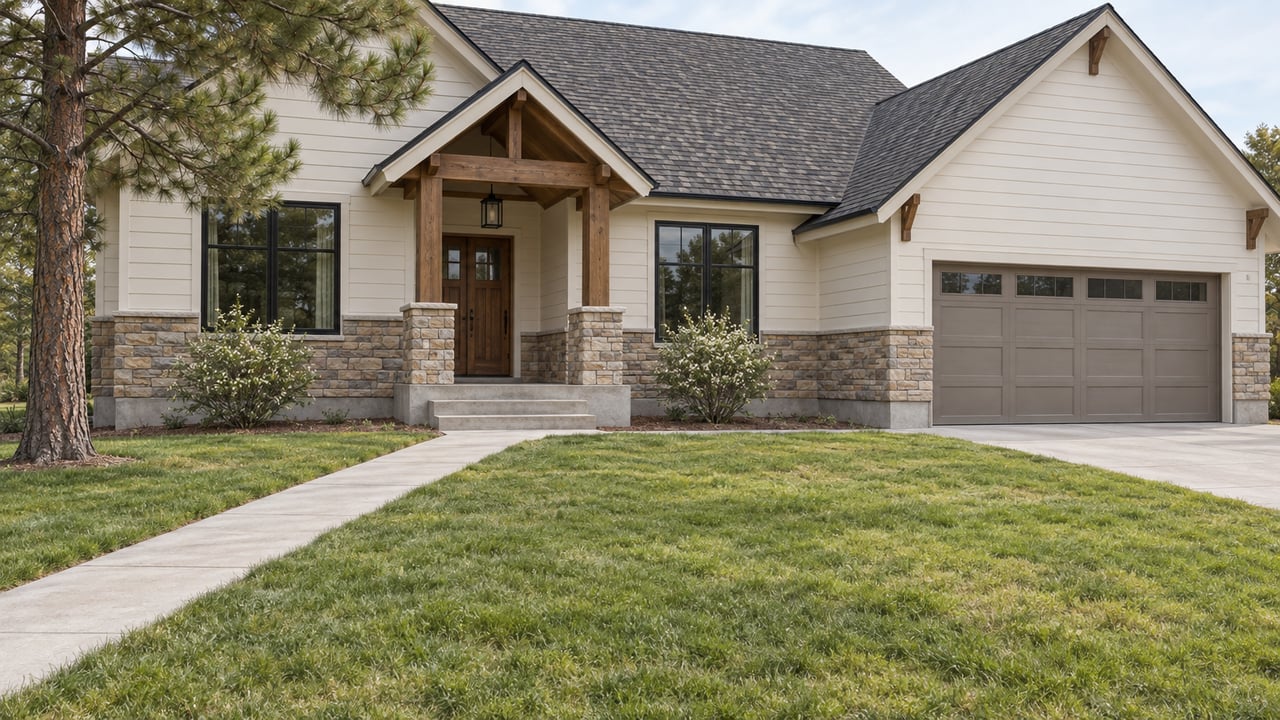
Why Gleneagle Doesn't Have One Median Home Price
October 1, 2026
October 1, 2026
Type "Gleneagle home prices" into a search bar this month and you'll land on two Redfin pages that disagree with each other by more than a quarter million dollars. One says the median home in Gleneagle sold for $570,000 over the three months ending June 2026. The other says $835,000, for the three months ending May 2026. Same neighborhood name. Same site. Two numbers that aren't close to the same ballpark.
This isn't a typo and it isn't one source being wrong. It's what happens when a neighborhood's housing stock is genuinely split into two different products and the sample size is small enough that a handful of closings can swing the average by six figures. If you're comparing Gleneagle to Woodmoor or Northgate using a single median price, you're comparing a number that depends entirely on which few homes happened to sell that month.
Redfin's city-level page for Gleneagle, built around the broader boundary that shares ZIP code 80921 with the Air Force Academy area, recorded 41 home sales in June 2026, up from 38 the year before, with a median price per square foot of $196, up 10.7% year over year. Its separate neighborhood-level page, drawn tighter around the older, established core of Gleneagle, recorded just 5 sales in May 2026, up from 4 the year before, at a median price per square foot of $166, down 8.0% year over year.
Look at what that actually means. The polygon with the higher total median price, $835,000, has a lower price per square foot than the polygon reporting $570,000. That's not a luxury premium showing up in the data. It's bigger homes selling, not more expensive homes per square foot. With only five closings in a month, the median is highly sensitive to which five houses sold, and their size pulled the number wherever it happened to point.
The days-on-market figures make the same point from a different angle. The broader city-level page shows homes selling in 38 days, barely different from 36 days the year before. The tighter neighborhood page shows homes taking 37 days to sell in May 2026, up from just 20 days the year before, which is an 85% jump. Across greater Colorado Springs, the metro-wide days-on-market figure moved from 44 to 42 days over the same general window, essentially flat. A shift that barely registers at the county level looks dramatic inside a dataset built on single-digit monthly sales.
Here's how the same neighborhood reads across the public estimates available right now:
| Source | Window | Figure | Sample size |
|---|---|---|---|
| Redfin (city/ZIP boundary) | 3 mo. ending June 2026 | $570,000 median | 41 sales in June |
| Redfin (neighborhood boundary) | 3 mo. ending May 2026 | $835,000 median | 5 sales in May |
| Zillow Home Value Index | current | $611,628 typical value, up 24.1% YoY | index, not a sale median |
| Homes.com | July 2026 | $619,200 median / $635,681 average | active + recent listings |
| NeighborhoodScout | early 2026 estimate | $678,291 median | modeled estimate |
Five sources, five different numbers, none of them technically wrong. They're measuring different boundaries, different time windows, and in some cases an index value rather than an actual closed sale.
The reason a handful of sales can swing Gleneagle's median so hard traces back to what actually got built here. Gleneagle's core is mostly 1980s and 1990s construction on large lots, often a half acre or bigger, the kind of established ranch and two-story homes that make up the bulk of monthly transaction volume. But Gleneagle also includes newer construction built directly on the footprint of the neighborhood's former golf course, which closed years ago and was gradually redeveloped into residential lots.
The Vistas at Gleneagle, one of the newer sections built on that former course land, is marketed around estate-sized lots and custom-built homes, some of which have appeared in the local Parade of Homes. Elevation Homes, a small custom builder active in that section, has advertised the ability to build there for under $150 per square foot in construction cost, with builds completed in under eight months. That's a meaningfully different product, and a meaningfully different cost structure, than a resale ranch home from 1988.
When one of those custom estate builds closes in the same month as three or four older tract homes, the total dollar median jumps even though the per-square-foot value doesn't necessarily follow, because square footage on the estate lots tends to run larger. That's the mechanism behind the $835,000 figure with the lower price-per-square-foot reading. It's not that the tighter Redfin polygon is capturing a luxury pocket. It's capturing a small, size-driven skew in a market too thin to average it out.
If you're using Gleneagle's median price to decide whether it's in budget compared to another suburb, the boundary and the sample size matter more than the headline figure. A few practical adjustments make the comparison more honest.
Ask for a comp set filtered to the actual subdivision, not the ZIP code or the "neighborhood" label a portal assigns. A home in the original golf-course-era section of Gleneagle and a home in the Vistas section are not interchangeable for pricing purposes, even though every public site will lump them under the same name.
Weight price per square foot over raw median price when the sample is this small. It's a noisier neighborhood for medians precisely because so few homes trade in a given month, and $/sqft is somewhat more resistant to a single oversized closing distorting the whole read.
Keep the county-wide backdrop in view for scale. Across greater Colorado Springs, the median sale price over the three months ending August 2026 was $460,000, down 3.2% year over year, with 2,071 homes sold that month. Whichever Gleneagle figure you're looking at, $570,000 or $835,000, the neighborhood is selling above the metro median either way. That part of the story holds regardless of which polygon produced the number.
If you're comparing an appraisal, this matters even more directly. An appraiser pulling comps from a wide, ZIP-based data pull will land somewhere different than one pulling tightly from the golf-course-era section alone, and in a market this thin, that choice can shift a valuation by tens of thousands of dollars before anyone's even walked the property.
Which number should I actually trust if I'm pricing my own home? Neither headline figure on its own. The number that matters is the median for homes genuinely comparable to yours in size, age, and section, pulled from actual closed sales rather than an index. A local agent pulling MLS comps filtered to your specific pocket of Gleneagle will get closer than any portal-level median.
Does this kind of boundary discrepancy affect financing or appraisal? It can. Appraisers are required to use comparable, recently sold properties, and in a market with only a handful of monthly closings, the choice of comp radius and property type has an outsized effect on the appraised value, which in turn affects loan-to-value ratios and how much cash a buyer might need to bring if an appraisal comes in under contract price.
Why does Zillow's number look different from both Redfin figures? Zillow's figure is a home value index, a model that estimates typical value across the full housing stock rather than a median of homes that actually sold and closed in a given window. It moves differently than a sales median because it isn't limited to the small number of transactions happening in any given month.
If you're weighing Gleneagle against another northern Colorado Springs suburb and want a number that actually reflects the section of the neighborhood you're looking at, not a portal average pulled from whichever boundary happened to load, The Fletcher Team & Associates can pull the real comps and walk you through what they mean before you make the comparison.
Brighten Every Room in Your Monument Home Year-Round.

Elevation-Smart Yard Design for Monument, Colorado, Homes.

Your Guide to Mortgage Pre-Approval Before You Start the Home Search in Monument.

Design Details and Small Luxuries That Elevate Your Morning Routine in Monument.

Practical, Green Upgrades for Eco-Friendly Homes in Monument.
Having the right real estate team means having a team who are committed to helping you buy or sell your home with the highest level of expertise in your local market. This means also to help you in understanding each step of the buying or selling process.
Get In Touch With Our Team
155 2nd Street Monument, CO 80132